Apr 20, 2012

Data Visualization as a planning tool


When Statistics marry Graphics, it creates immense possibilities.

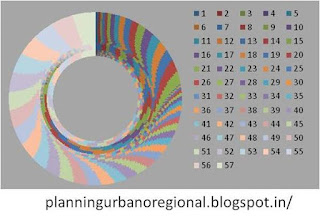
Data is lifeblood of planning and holds massive information potential, need is to decode the pattern it holds, pattern of importance, patterns which are vital and patterns which help understand the previously unexplored recesses of statistics. Now we have datamining tools to extract and visualize data, sources which were previously nonexistent, data from social media, data from online resources etc..

These charts have been created from number series (Fibonacci number), just to represent clear, informative and convincing patterns which can be derived from numbers. Numbers tell stories!!   


Key strengths and potential sectors of Indian states

ANDHRA PRADESH
ITES destination
Industrial estates
Abundant energy
World-class academic institutions
Storehouse of minerals

ASSAM
Comprehensive central investment policy for NER
Liberalised state industrial policies,
Skilled and cheap manpower
Pleasant climate and scenic landscape
Locational advantage for foreign trade

CHHATTISGARH
Power surplus
Availability of low grade coal-power plants
Ample amount of land

HARYANA
High per capita income
Proximity to trade and consumption centers in country- NCR
Automobiles and automotive components
IT/ITES facilities /software,
Textiles and readymade garments
Property development and retailing
Agro export

HIMACHAL PRADESH
High incentives index
Consumer market index
Most urbanised state
Low power tariff and cost of power generation
Policy proactiveness
Availability of natural resources for agro-based industries
High literacy rates and good quality workforce
High quality limestone

JAMMU & KASHMIR
Concessional land rates for industries on lease
Large tourism potential
Horticulture industry
Skills of weaving and designing of textile products,
Traditional skills of fine craftsmanship can be used in the field of electronic and precision engineering.

KARNATAKA
Proactive government
Sector-friendly policies
Large pool of skilled manpower
Best infrastructure
Larger focus on industrial growth

KERALA
High literacy rate
Largest producer of coconut, pepper, coir, cocoa, rubber and areca nut

MADHYA PRADESH
Law and order
High growth in infrastructure development..
High growth in agriculture
Good governance.
Centrally located, / accessible
Low cost of skilled labor
Low cost of land
Cement, textiles and edible oils.
Track record of attracting private investment in transport infrastructure
Initiated greenfield special economic zone.
Automobile and pharmaceutical industries
Improving social development indices

RAJASTHAN
Cement
Mineral production
Producers of cotton and wool
Tourist destination
Progressive states in electricity sector reforms
Oil and gas reserves
Emerging destination for it and ITES industries

UTTARAKHAND
Hydro-potential
Promoting industrial estates, industrial parks and growth centre
Vast pool of a natural resource
Tourism development
Quality human resource base at competitive rates
Number of fiscal benefits like concessional industrial package


By Anoop Jha


Source: pppindia.com

Apr 18, 2012

Municipal Finance in India : Municipal Tax Revenue sources

Municipal Revenue generation through Taxation in India

“Local Self Government becomes meaningless in the absence of financial autonomy. It enjoys the power of imposition of local taxes. The municipal bodies must have a wider scope of collection of revenues”
(Source: UIDSSMT)


ULBs have invented many channels and instruments of revenue generation in course of time due to urgency of handling growth, some of the tax sources both conventional and non-conventional, are mentioned below.


TAXES/FEES

CONVENTIONAL MUNICIPAL REVENUE SOURCES

Composite Property Tax
Water Charges
Sewerage Charges
Conservancy Charges
Building Permit Fee
Development Charges
Trade Licensing Fee
Advertisement Tax
Shop Room Rent

OTHER GENERAL MUNICIPAL REVENUE SOURCES

House Tax 
Show Tax  
Building Plan Fee
Tax on the consumption of Electricity    
Sale of liquor     
Cess on the transfer of immovable property   
License for Dangerous and Offensive trades
Rates are varied in respective ULBs
Rehari License Fee
Tehbazari Tax
Slaughter House Fee
Cattle Pound Fees
Birth & Death Certificate Fee
Copying Fee
Tree Cutting Fee
Library Membership
Ground Tax
Vehicle License Fee
Death & Birth Reg./ Late Fee
Forest /Garden Income
Dog License Fee 
Animal Tax (Cattle Pound)
Trade License Fee
Tax on advertisement other than advertisement published in the newspaper.


NON-CONVENTIONAL MUNICIPAL REVENUE SOURCES

Vacant Land Tax
Service Taxes
Surcharge on Land Registration Duty
Water Supply Donations
Water Supply Connection Charges
Water Benefit Tax
Water Betterment Charges
Sewerage Donations
Sewerage Connection Charges
Sewerage Benefit Tax
Sewerage Betterment Charges
Bulk Garbage Collection Charges
Betterment Charges
External Betterment Charges
Open Space Contribution
Impact fee
Transferable Development Right
Premium FSI
Sub-division charges
Planning Permission Betterment
Road Cutting Charges
Street Tax
Frontage Tax
Cess on Infrastructure
Motor Vehicle Tax/Surcharge
Tax on Petrol and Diesel
Business License Fee
Hoarding Charges,
Advertisement Placement Fees,
Cable TV Fee,
TV Advertisement Charges
Royalty on Auctions


INNOVATIVE /UNIQUE MUNICIPAL REVENUE SOURCES

General Obligation Bond/ Municipal Bond
Awarding of development rights,
Town planning schemes (TPS)
Plot/layout readjustment
Additional FSI/FAR
Goodwill auctions
Bank linkages (for Urban Poor)
Capital-based property tax system
Land banking
Transferable development rights (TDR)
Special Education tax
Pilgrim
Octroi
Special and General Sanitation
Shows
Toll on Vehicles,
Timber
Terminal
Menial Domestic Servants
Artisans
Entertainment Tax

SOME OF THE UNIQUE REVENUE STREAMS (THROUGH FEES/ CHARGES) OF MUNICIPALITIES ACROSS MAJOR STATES IN INDIA

Registration Fee
Mutation Fee
Market Fee 
Trade License Fee
Compounding Fee
Slaughter House Fee
License Fee
Betterment / Development Fee
Fire Brigade
Public Health
Swimming Bath Fee,
Stock Registration
Cattle Pound Fee
Teh Bazari Fee
Pilgrim
Scavenging
Prevention of Food Adulteration Fee
Dangerous and Offensive Trade License Fee
Animal Registration Fee
Compounding Fee
Warrant Fee
Bus Stand Fee
Copying Fee
Cart Stand Fee,
Encroachment Fee
Fees from burning ghats
Birth and Death Registration Fee


Sources:

Apr 16, 2012

Rural Development Schemes in India

Some of the Schemes launched by Government of India (GoI) at present and in Past under deferent department and mission for Rural Development are listed below with the website link or relevant resources. 


Ministry of Rural Development-MoRD (http://rural.nic.in/)

Department of Rural development-DoRD (http://drd.nic.in/)
Department of Land Resouces-DoLR (http://dolr.nic.in/)
 Bharat Nirman (http://www.bharatnirman.gov.in/ )

By- Anoop Jha

Apr 11, 2012

“Smell Architecture”!! We have to accept non-tangible design elements as part of architecture and Urban Design!!

Walking down the buzzing food streets of the world is a thrilling experience for most of us, it’s a play field of light and shadow, sound and noise, colors, textures and smell. Smell of street, smell of variety of foods being baked, grilled, processed, and served with love from generations, aroma of spices in the air, that raw fragrances of freshly chopped vegetables, occasional breeze with hint of what is being cooked inside, looking at the faces of crowd apparently engulfed and hypnotized by the tempting aroma of food, all this combined together with the built architecture of street gives an experience which is complete and memorable.


Now take a few steps back and rewind the tour without “Smell” part of the whole experience, and you will realize how important these intangible elements like smell, sound etc. play in making architecture and urban design a complete experience.  Though Light is also an intangible element but it has been given an undue advantage in architecture since centuries, contrary  to its counterparts like smell,sound etc. Unfortunately they don’t teach this in architecture and planning school as well, probably they themselves have unable to understand the significance of such non-tangible elements of architecture. Unfortunately there focus has remained on mass-producing architects, designers and technical hands through proven formulas and they have confined themselves in the predefined boundaries of architecture like, form,  function, space, texture, colors, at most interplay of light and shadow. What about smell, noise, feelings and state of mind of users, experiencing and validating the existence of the architecture and urban design in the first place?

It’s not a hypothetical assumption but a fact that you can’t create a good architecture without a great user experience which involves variety of non-tangible elements, those elements which can’t be quantified in form of project specification items into a spreadsheet.  It’s high time that architects and urban designers should shift focus towards the ambient environment and users experience since they have already mastered the art of form and space through accumulative knowledge of centuries. It’s time to move on.

By - Anoop Jha

Mar 30, 2012

Why public transport system should reach breakeven much before projected

Dilemma of perceived order and actual chaos

A case of typical buzzing metropolitan city of any developing country

Ever wondered while travelling in a suffocatingly overcrowded metro or local train that whether they might have shown similar huge footfall numbers in their design and financial reports? Don’t think so. Because they can’t!!

No guideline in the world allows such high density of footfall per unit area within any public transport system, because that is insane, that is inhuman. But unfortunately its happening, because huge gap of demand and supply. And we accept it, we don’t mind, we don’t question, we don’t have option, we not only accept it, we often praise it, of course public transport is a wonderful system of mass transit, but no wonder why a huge segment of population still prefer to travel by their own car, spending money and time like anything, just to get a private breathing space inside their personal car.

When it comes to transport numbers and financial projections for mass public transport system in overpopulated cities of developing countries, it’s usually purposefully flawed. Why? There is a catch. Metro and rail coaches are designed to accommodate a fixed maximum carrying capacity based on standards and international norms. Sounds good!! Because these standards consider the acceptable optimum and comfortable footfall/ ridership density as there thumbrule with some inbuilt tolerance for unexpected occasional growth in ridership and of course while doing design and financial projections for the MRT projects, consultants take these standard thumbrules as there basis for calculation with some contingency/ margin and they model there business plan as per this acceptable norms. They can’t show realistic overcrowded scenario in their financial calculations and projections because no financing agency/ bank/ partner will accept the model which is prepared by breaking the rule- like standard acceptable ridership density. Technically and morally they can’t propose a transport system which will be operating at an efficiency of 150-200% of its design capacity even if it is an inevitable case, because its unsafe, because it’s not acceptable on many grounds, at least they can’t disclose it in public domain otherwise there would be too much of hue and cry on the subject.  So when they come up with a financial projection with specified breakeven point, that breakeven point might not be realistic, it might be far beyond the actual realistic date. In actual overcrowded scenario more footfalls should help achieve breakeven point much early than projected.

It’s high time for those metropolitan cities which are struggling to provide an adequate and morally acceptable comfort level to its people, either in its transit system or may be in domain of housing and who repeatedly fail to provide the same due to unmanageable population growth and financial constraints, should recognize their constraints, and devise an operational methodology which is more realistic and suitable to their specific need.


May be they should accept inevitable higher population density and need to revise the ridership density thumbrule/ standards, reflecting real life scenarios of the city accepting their limitations, and should use the same in design and financial calculation. Understanding its limitations and inevitability of growth, may be a high density city needs a tougher and much robust metro and rail coaches with robust inbuilt facilities, robust air-conditioning system, higher air exchange rate, temper-proof interior, with more sophisticated audiovisual information system for fast and safe passenger exchange to avoid chaos due to confusion, may be they need better imbedded security system, may be they need to be educated in the school itself how to travel and behave in an overcrowded public transport system. May be they need to be educated in the planning schools to take into account real life scenarios while learning projections, maybe planners should be taught to challenge the validity and contextuality of thumbrules, established norms, methods and age old theories 
rather than simply imitating and following them in decades of inertia.  We will definitely have more and more sophisticated simulation tools for better understanding of the situation and more realistic projections, but we will still need human perception and judgment for a holistic planning which is beyond those formulas.

Some thoughts on socio-economic projections can be found here in another post titled “How reliable are socio-economic future projections?” http://planningurbanoregional.blogspot.in/2011/11/how-reliable-are-socio-economic-future.html


By- Anoop Jha

Mar 27, 2012

Defying purpose of sidewalks: its story of many developing cities

They sleep, they socialize, they play, they construct, they're born, they die, they live, they beg, they sell and they do everything on that thin and broken strip of exposed sidewalks, but walking. They defy the very purpose of sidewalk.


Apparently It’s not their choice; for some its fate, for some its livelihood, for some its entertainment for some its greed. Sometimes it’s the only piece of land available in a big crowded city for those poorest of urban poor, sometimes it’s the most accessible everyday market place for those returning home from work, sometime its paradise for street food lovers, sometimes its playground for street kids, sometimes its breeding ground of crime, sometimes abandoned sometimes encroached sometimes its provider and sometimes victim of business greed, used for everything, but walking. It’s the story of almost every city of developing countries. In the absence of regular, appropriate, continuous and user friendly sidewalks and footpaths across the city and without better livelihood opportunities and ample urban housing, this phenomenon is going to inevitably present itself in different forms.